Maps
Geo-story maps can range from simple drawings to full-featured GIS presentations with audio-visual interactivity cued off the display. The EARTHscope player can bring simple flat maps to life, allowing users to manipulate the territory in a variety of ways such as panning, zooming, and selecting which layers of information to view. In ES v3.0, users will be able to click or roll-over areas of interest to activate more information: graphics, text, audio, video, or even the Internet (including your web pages). The EARTHscope player also lets you add the dimension of time to what have historically been static (or series of static) displays. Time-sequence data and map-based animations can show historical, present, and possible future change over time, including alternate "what if?" scenarios.
Map Types & Formats
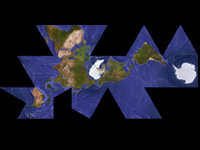
You are not limited to a single map type, format, or projection. Different maps can show different types of data - biodiversity, population, geographic features, social trends, etc. - and be displayed together in sequence, as layers, or in different chapters of your overall story (see Multiple Maps, below). The EARTHscope supports a variety of formats, perspectives, and sizes -- see the content specifications for more information. It's generally better to start with an electronic map, but they can be in almost any format: paper, photograph, 3-D model, or a geo-referenced database. As long as they can ultimately be converted into a computer file (by scanning or digital photograph) your maps can be used. Geo-story maps can be sea charts or globes, topographic representations or aerial photographs. Mercator projections of continents or sketches of bicycle delivery routes. Architectural blueprints for an entire city or cross-sections of an anthill. Flowcharts map out processes. Calendars are maps of time. Feel free to use your creativity to tell the most effective geo-story possible.
Multiple Maps The EARTHscope interface also offers unique time-control functions, to show changes over time and alternate scenarios (for example, a map of the same forest in 1950, 2000, and projections for 2050). For best results, animated or time-lapse maps should cover the same territory, showing changes in the data projected on a single map. Obviously, not all historical maps use the same projections or cover exactly the same area, but a close match makes for better viewing.
Layers This powerful feature lets users explore and interpret your maps in a way that suits their needs, exposing often unseen interrelations and exciting user interest. For example, a wildlife habitat map could include separate layers showing cities, roads, and migration pathways to show the complex influences these elements have on each other. Layers can also be used to build a more complex map from more basic elements. Simpler maps with different data projected on the same territory can be combined as different layers to generate a visual- and information- rich environment. You can even combine maps from different sources to show multiple dimensions (such as a satellite photo underlying a street map for added realism). Layers can be as simple or complicated as your geo-story demands. Some source formats lend themselves to layering more easily than others -- please see the content specifications for more information. |
Features
Context
RBF's Geoscope
Team & Advisors
![]()
Content Pipeline
Conferences
Press
Resources
Archives
![]()
Geo-story Design
Maps
Text
Media


| HOME | LAUNCH EARTHSCOPE | OVERVIEW | WHATS NEW | GEOSTORIES | ES R+D | ES INITIATIVES | CONTACT |
 |
EARTHscope is project of the Buckminster Fuller Institute (BFI), and the leading edge of our spaceshipEARTH initiative. |

